Table of Contents
What is ROE or Return On Equity?
The return on equity (ROE) is a tool to evaluate financial performance metrics that are determined by dividing net income by shareholders’ equity. Typically, this is given as a percentage.
Return on equity is often referred to as return on net assets. This is because shareholders’ equity is equal to the sum of a company’s assets and liabilities. This statistic is important for determining a corporation’s profitability and efficiency.
The ratio considers one item from the income statement (net income) and one from the balance sheet (shareholders’ equity). The ROE demonstrates a business’s capacity to profit from its equity investments. Investors can figure out how much profit the business can make for each rupee they invest.
Return on equity is, for the most part, a ratio that measures the rate of return that the company’s shareholders, or common stock owners, get on their investment. Primarily, the ratio shows if the company makes a good profit on the money its shareholders put in.
How to Calculate Return On Equity?
ROE is calculated by dividing the company’s net income by the average shareholder equity. Due to the fact that shareholders’ equity equals assets minus liabilities, ROE is essentially a measure of the return made on a company’s net assets.
Since the equity values change over the course of an accounting period, an average shareholder’s equity is utilized.
Return on equity is calculated as 100 percent* (net income or profits/shareholder’s total equity); the denominator, or shareholder’s equity, refers to the difference between the company’s total assets and liabilities. Additionally, if the corporation decided to pay down its existing creditors at any point in time, the shareholder’s equity would equal whatever was left.
Simply expressed, it is calculated by dividing the company’s net income as taken from the most recent income statement by the period’s total equity.
Another way to calculate ROE is to use average total equity, which is the average equity value between the start and end of the year.
Return on Equity Formula:
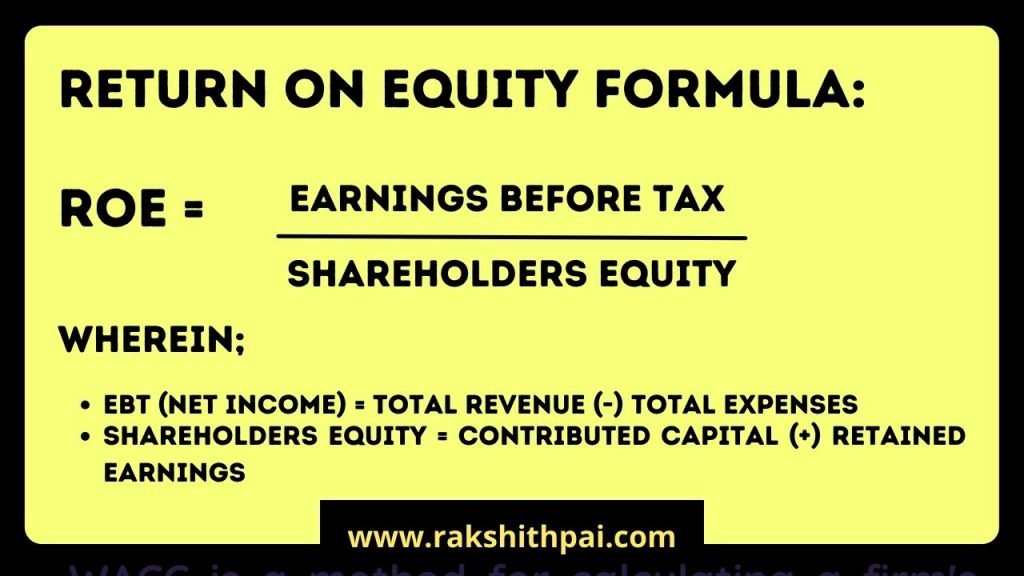
For Example;
Company ‘A’ has Earnings Before Tax or Net Income of Rs.100 crores. And, Total Shareholders Equity (i.e, Equity shareholders Capital + Reserves & Surplus) of Rs.1,000 crores.
In the given case, based on the above-mentioned formula, we divided Rs.100 by Rs.1,000 to arrive at Return on Equity of Company A at 10%
Interpretation of ROE:
A high ROE indicates that a management team is more effective at utilizing available financial resources to expand the business (and is more likely to provide better returns to investors). Low ROE, on the other hand, could mean that a business is not being properly run and that it is reinvesting earnings into assets that don’t work as well as they should.
A return on equity of one rupee indicates that one rupee of common stock will create one rupee of net revenue.
Advantages of ROE Ratio:
Determine the growth rate
The return on equity ratio is often thought to be a good way to figure out how quickly a company’s shares and dividends grow.
Typically, such an increase is calculated by multiplying a company’s ROE by its retention ratio. In this case, the “retention ratio” is the percentage of net income that is kept or invested to help the company grow.
Prediction of Long-Term Growth
Return on equity ratio research also aids in determining a company’s growth sustainability. Investors can use this financial measure to figure out which stocks are more likely to be affected by market risks and financial instability.
For example, a firm whose stock is increasing at a slower pace than its sustainable rate may be perceived as cheap or financially ailing in the market. In the same way, a company that grows faster than it can keep up within the long run looks bad to the public.
Additionally, investors may use the ROE ratio to forecast a company’s dividend growth. It is possible to get a very accurate estimate of this type of thing by multiplying the company’s ROE by its payout ratio.
Regardless, if a company’s dividend growth rate exceeds or falls below its sustainable growth rate, this could be a sign of problems with the company’s operations.
Determine problems with efficiency
Excessive debt, irregular returns, and negative income are just a few of the concerns that the ROE ratio may be used to investigate. An unusually high ROE ratio may be a sign that there is a risk or hazard, but this isn’t always the case.
For instance, if a company’s net income is comparatively large in comparison to its equity, a high ROE is seen as a sign of the company’s strength. However, equity that is less than net income frequently indicates hidden hazards.

Disadvantages of ROE Ratio:
While ROE is often regarded as one of the most effective financial indicators for determining a company’s financial efficiency, it does have certain drawbacks. To begin with, returns on equity do not necessarily have to be positive. A subjective ROE could be a sign of a lot of other problems, like a lot of debt and fluctuating income.
Similarly, a negative return on equity ratio resulting from negative shareholder equity or a net loss is ineffective for evaluating a company’s competence.
Another thing is that it can’t be used to compare the abilities of businesses that make a good return on their money.
Apart from these, the ROE ratio frequently overstates a company’s economic worth, which is determined by a variety of economic factors.
The following highlights many of these factors and their relationship to ROE:
Manipulatable
As with any other formula-based Research tool, ROE can also be manipulated. Inflate or Deflate the Earnings and Shareholders Equity Blace and you can tweak the ROE figures as you want.
Earnings can be manipulated by fudging asset value & posting fake earnings and such. WHereas the Shareholder’s Equity can be inflated or deflated by just changing the free float equity shares by means of Bonus issue and Buyback of shares.
Debt Based Rapid Growth
Companies that tend to grow aggressively with add-on liabilities be it Equity or Debt capital will usually tend to show reduced Return on Equity. But, this shouldn’t be our approach to evaluate the company.
A company that is growing aggressively could be able to reduce its debt portion in the future and even reduce the equity dilution.
Expense Factors
Factors such as Depreciation & Amortisation Expenses, Finance Cost, Other cost and even Exceptional Items could change the Net Income and thus reduce the ROE.
Higher cost results in reduced earnings thus decreased ROE ratio.
Excessive debt, irregular returns, and negative income are just a few of the concerns that the ROE ratio may be used to investigate. While an abnormally high ROE ratio may signal the presence of an underlying risk or hazard, this is not always the case.
For instance, if a company’s net income is comparatively large in comparison to its equity, a high ROE is seen as a sign of the company’s strength. However, equity that is less than net income frequently indicates hidden hazards.
ROE and DuPont Analysis:
In the 1920s, the American chemical company, DuPont, devised a method for determining which components of a company’s return on equity (ROE) make the most or least difference. Though ROE may be simply calculated by dividing net income by shareholders’ equity, a technique known as “DuPont decomposition” can further simplify the ROE calculation.
DuPont provides a more complete picture of a company’s ROE by assessing what is changing throughout the organization rather than focusing just on one single ratio. They should be compared to previous data from both the company and its competitors.
For instance, when comparing two comparable firms, one may have a lower return on equity. With the DuPont calculation, you can determine if this is lower because creditors view the business as riskier and charge it a higher interest rate; if the business is poorly managed and has excessive leverage; or if the business has higher costs that reduce its operating profit margin.
There is more knowledge about the company and how it should be valued if you find out where these sources are coming from.
DuPont analysis is essentially determining the many factors that contribute to the ROE. It is a technique employed by analysts to examine the ROE under a magnifying glass.
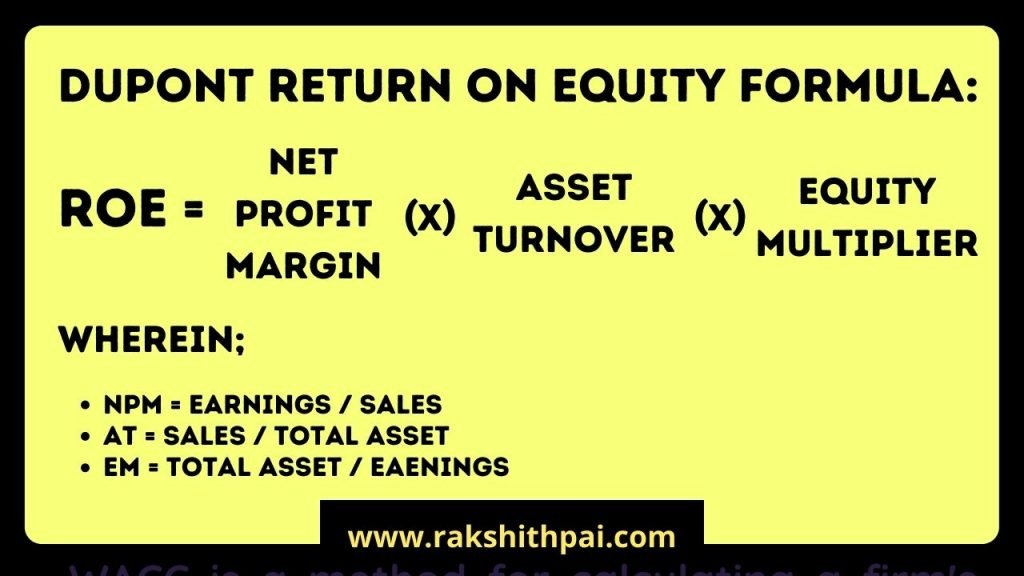
DuPont Return on Equity Formula:
Return on Equity (v/s) Return on Invested Capital:
Investors should make a point of understanding the distinction between the ROE ratio and the return on invested capital to avoid becoming confused. The ROE concept would also be easier to understand if you knew the differences between the two things.
To begin with, the ROE ratio assists investors in determining the profit that a business is anticipated to make from shareholder stock. On the other hand, return on invested capital assists them in determining how much money a business earns from various sources of capital.
ROE enables investors to evaluate a company’s efficiency in utilizing shareholders’ equity. On the other hand, return on invested capital (ROIC) helps measure how well a business uses available capital to produce additional revenue.
The growth prospects of a business are critical in determining its profitability. As a result, investors must design methods to verify the same before investing in them.
Return on Equity and Debt:
ROE as a single metric is often more effective when assessing debt-free businesses. This is because having an excessive amount of debt on the balance sheet might cause the ROE to show an irrational result.
This is due to the straightforward accounting equation “Equity = Asset – Liabilities (Debt)”. And, as a general rule of accounting, as the denominator drops, the fraction as a whole grows, resulting in a greater ROE.
Importance of RoE for investors/Shareholders in the firm
Return on equity (RoE) is important for shareholders because it lets them see how well a business is able to use its money to make more money.
Market experts have always suggested investing in companies with a high return on equity. Stocks with a high return on equity have the potential to double investors’ money in three to four years. The stocks mentioned below are market leaders in their respective industries and have the largest range of returns on equity.
How to use RoE to make a better stock selection?
The RoE-parameter may only be used to choose companies within the same sector. This is because there might be a significant disparity in net income or profit margins between industries. Additionally, within a sector, the RoE values may vary. This is when a company in that industry may decide to distribute dividends rather than hold profits as idle capital.
As a result, we deduce that ROE varies among sectors; for example, a typical ROE in the utility sector may be as low as 10%. Similarly, for retail or Information Technology (IT) businesses, the typical return on equity (ROE) is 18% or above.
As a general guideline, you may pick stocks based on ROE by picking or targeting a stock that has an ROE that is equal to or slightly above the peer group average. Another critical issue that cannot be neglected is that the return on equity is even more significant than the return on investment since it informs shareholders about the efficiency with which their money is reinvested to generate profits.
Generally, the higher the return on equity, the greater the potential of the business to earn cash. Thus, a greater return on equity indicates that the firm is in a stronger position in terms of its ability to generate profits for its owners.
Top 10 High ROE Stocks in India – (Large Cap)
| S.No. | Company Name | ROCE 5Yrs Average (In %) | ROE 5Yrs Average (In %) | P/E Ratio | EV/EBITDA | PB X PE | PEG Ratio | Debt / Equity | ROCE (In %) | ROE (In %) | ROIC (In %) | ROA 12M (In %) | EPS 12M (In Rs.) | Market Cap (In Crores) |
|---|---|---|---|---|---|---|---|---|---|---|---|---|---|---|
| 1 | Britannia Industries Ltd | 44.28 | 35.92 | 54.70 | 35.65 | 2,504.71 | 3.12 | 1.57 | 45.27 | 46.89 | 75.36 | 23.38 | 62.66 | 82,556.40 |
| 2 | Coal India Ltd | 62.08 | 45.47 | 6.85 | 3.46 | 17.74 | -2.98 | 0.08 | 46.07 | 36.99 | 17.53 | 8.17 | 24.75 | 1,04,489.06 |
| 3 | Colgate-Palmolive (India) Ltd | 74.94 | 55.73 | 36.89 | 24.49 | 870.97 | 3.24 | 0.06 | 92.00 | 75.07 | 125.00 | 37.68 | 39.32 | 39,448.80 |
| 4 | Hindustan Unilever Ltd | 74.36 | 53.82 | 57.83 | 39.33 | 615.31 | 4.03 | 0.02 | 39.21 | 29.23 | 15.95 | 18.39 | 37.29 | 5,10,354.72 |
| 5 | Marico Ltd | 42.82 | 35.75 | 55.10 | 37.48 | 929.54 | 5.10 | 0.09 | 43.99 | 36.72 | 45.87 | 22.88 | 9.24 | 66,531.79 |
| 6 | Nestle India Ltd | 91.79 | 64.10 | 89.12 | 52.37 | 7,271.30 | 6.55 | 0.13 | 126.12 | 93.00 | 67.70 | 23.69 | 222.46 | 1,70,069.13 |
| 7 | Procter & Gamble Hygiene and Health Care Ltd | 73.94 | 50.86 | 87.05 | 59.06 | 4,920.07 | 9.65 | - | 93.78 | 69.78 | 141.24 | 37.74 | 177.96 | 50,283.79 |
| 8 | Page Industries Ltd | 58.45 | 44.08 | 102.08 | 65.78 | 4,805.93 | 12.70 | 0.11 | 48.23 | 40.00 | 39.04 | 21.23 | 413.82 | 47,115.66 |
| 9 | Tata Elxsi Ltd | 45.23 | 31.65 | 79.34 | 52.66 | 2,462.71 | 4.22 | 0.08 | 40.03 | 29.92 | 28.29 | 23.53 | 81.06 | 40,055.27 |
| 10 | Tata Consultancy Services Ltd | 45.56 | 35.16 | 34.92 | 23.45 | 473.52 | 5.09 | 0.08 | 48.90 | 39.06 | 58.23 | 26.75 | 101.77 | 13,14,716.84 |
- ROCE % – Return on Capital Employed in percentage, per-annum.
- ROE % – Return on Equity in percentage, per-annum.
- P/E – Price to Earnings ratio.
- EV/EBITDA – Enterprise Value to Earnings Before Interest, Taxes, Depreciation, and Amortization expenses.
- PEG – Price to Earnings Growth ratio.
- ROCE 5 Years – Return on Capital Employed in percentage, 5 years average.
- ROE 5 Years – Return on Equity in percentage, 5 years average.
Top 5 High ROE Stocks in India – (Mid Cap)
| S.No. | Company Name | ROCE 5Yrs Average (In %) | ROE 5Yrs Average (In %) | P/E Ratio | EV/EBITDA | PB X PE | PEG Ratio | Debt / Equity | ROCE (In %) | ROE (In %) | ROIC (In %) | ROA 12M (In %) | EPS 12M (In Rs.) | Market Cap (In Crores) |
|---|---|---|---|---|---|---|---|---|---|---|---|---|---|---|
| 1 | Alembic Pharmaceuticals Ltd | 24.63 | 25.35 | 18.74 | 13.58 | 51.54 | 1.81 | 0.17 | 26.01 | 28.23 | 35.09 | 17.98 | 38.71 | 14,256.72 |
| 2 | Alkyl Amines Chemicals Ltd | 37.97 | 35.27 | 56.58 | 38.35 | 969.78 | 1.32 | 0.04 | 55.80 | 44.58 | 43.03 | 30.72 | 53.11 | 15,338.59 |
| 3 | Computer Age Management Services Ltd | 52.04 | 36.13 | 44.44 | 29.71 | 1,182.55 | 2.16 | - | 57.70 | 43.98 | 97.71 | 27.81 | 56.20 | 12,197.99 |
| 4 | Castrol India Ltd | 81.57 | 56.65 | 14.09 | 8.42 | 91.44 | 5.28 | - | 67.44 | 49.55 | 53.86 | 29.74 | 7.66 | 10,682.52 |
| 5 | Gillette India Ltd | 49.26 | 34.25 | 59.26 | 36.18 | 1,216.61 | 7.78 | - | 51.04 | 36.44 | 56.82 | 22.56 | 87.65 | 16,926.27 |
Top 5 High ROE Stocks in India – (Small Cap)
| S.No. | Company Name | ROCE 5Yrs Average (In %) | ROE 5Yrs Average (In %) | P/E Ratio | EV/EBITDA | PB X PE | PEG Ratio | Debt / Equity | ROCE (In %) | ROE (In %) | ROIC (In %) | ROA 12M (In %) | EPS 12M (In Rs.) | Market Cap (In Crores) |
|---|---|---|---|---|---|---|---|---|---|---|---|---|---|---|
| 1 | Bajaj Consumer Care Ltd | 47.07 | 38.51 | 12.60 | 10.03 | 36.79 | -11.78 | - | 36.15 | 30.19 | 477.76 | 25.15 | 12.88 | 2,393.84 |
| 2 | Kanchi Karpooram Ltd | 55.70 | 45.41 | 7.90 | 4.28 | 14.30 | 0.06 | - | 66.26 | 50.40 | 40.29 | 45.59 | 90.40 | 310.15 |
| 3 | TAAL Enterprises Ltd | 65.50 | 46.00 | 14.75 | 8.66 | 82.16 | 0.07 | 0.12 | 61.44 | 49.85 | 37.34 | 30.58 | 101.59 | 467.11 |
| 4 | Hawkins Cookers Ltd | 60.48 | 51.07 | 32.36 | 21.55 | 523.26 | 2.42 | 0.23 | 57.19 | 50.83 | 42.02 | 23.36 | 163.57 | 2,798.67 |
| 5 | Gujarat Themis Biosyn Ltd | 65.46 | 57.56 | 12.36 | 8.57 | 62.67 | 0.27 | 0.02 | 66.90 | 53.81 | 43.95 | 39.61 | 27.27 | 489.54 |
Conclusion
In this article, we have explained what is ROE or Return on Equity, How to Calculate Return on Equity under the normal method and DuPont method, Meaning, Important Features, ROE Advantages, and Disadvantages, How ROE benefits shareholders and stakeholders.
We have also explained how to interpret the ROE ratio. And the difference between ROE and ROIC.
It is critical to look at ROE when evaluating a company’s financial efficiency. Therefore, before investing in any company’s shares, evaluate its recent ROE.
Avoid investing in firms with a negative return on equity. It is also not necessary to believe in a high ROE blindly. You should investigate the factors that contribute to the high ROE. A favorable ROE also demonstrates the management’s efficiency. That is why it is deemed critical to prioritize ROE when selecting a stock.
Disclaimer: All the information on this website is published in good faith and for general information purposes only.